Climate FieldView
Using digital crop intelligence to help farmers and advisors make timely decisions on their farms
My Role
Lead Designer
Skills
AI Tools
Cross-team Collaboration
Data Visualization
Design Sprints
Design Tokens
Hi-fi Design & Prototyping
Pilot Launch
Product Visioning
Research & Testing
Team
Alma Xhemalallari
Brett Ochs
Janelle Brankiewicz
Juan Arrizia Lopez
Luciano Fabre
Mike Johnson
Timeline
9 Months
Climate FieldView
Using digital crop intelligence to help farmers and advisors make timely decisions on their farms
My Role
Lead Designer
Skills
AI Tools
Cross-team Collaboration
Data Visualization
Design Sprints
Design Tokens
Hi-fi Design & Prototyping
Pilot Launch
Product Visioning
Research & Testing
Team
Alma Xhemalallari
Brett Ochs
Janelle Brankiewicz
Juan Arrizia Lopez
Luciano Fabre
Mike Johnson
Timeline
9 Months
Climate FieldView
Using digital crop intelligence to help farmers and advisors make timely decisions on their farms
My Role
Lead Designer
Skills
AI Tools
Cross-team Collaboration
Data Visualization
Design Sprints
Design Tokens
Hi-fi Design & Prototyping
Pilot Launch
Product Visioning
Research & Testing
Team
Alma Xhemalallari
Brett Ochs
Janelle Brankiewicz
Juan Arrizia Lopez
Luciano Fabre
Mike Johnson
Timeline
9 Months

Background
In agriculture, timing is everything.
Detecting insect pressure too late in the game, spraying fungicide outside its designated window, making an application when your fields are too wet—they are all consequences of poor timing. Crop Phenology, the progression of growth stages in crops, is a key indicator of timing. Growth stages inform how a crop is growing, what threats to look out for, and when specific applications can be made.
Detecting insect pressure too late in the game, spraying fungicide outside its designated window, making an application when your fields are too wet—they are all consequences of poor timing. Crop Phenology, the progression of growth stages in crops, is a key indicator of timing. Growth stages inform how a crop is growing, what threats to look out for, and when specific applications can be made.
Currently, farmers and advisors physically go into the field to observe what growth stage a plant is in. Outside of some clunky GDU calculators, the market lacks radically simple tools for understanding growth stages. What if we could predict growth stages and integrate additional pieces of crop intelligence into FieldView, Bayer Crop Science's digital farm management tool?
Currently, farmers and advisors physically go into the field to observe what growth stage a plant is in. Outside of some clunky GDU calculators, the market lacks radically simple tools for understanding growth stages. What if we could predict growth stages and integrate additional pieces of crop intelligence into FieldView, Bayer Crop Science's digital farm management tool?
Integrating predictive growth stages could help FieldView stand out as a digital tool and increase user adoption. Through the use of shared data, it could boost advisor confidence when they are consulting growers. It could even anticipate threats for Bayer's own seed products, and drive long-term business value by influencing purchase decisions.
Integrating predictive growth stages could help FieldView stand out as a digital tool and increase user adoption. Through the use of shared data, it could boost advisor confidence when they are consulting growers. It could even anticipate threats for Bayer's own seed products, and drive long-term business value by influencing purchase decisions.

Problem
The lack of streamlined tools for monitoring crop growth drives up operational costs, time investment, and margin of error.
We worked closely with customers and stakeholders to dissect existing challenges, with a focus on growth stages.
1
Productivity: Today, growers and advisors engage in scouting, in-field observations to monitor the growth and health of crops. When pests are imminent, fields need to be scouted even more frequently. As of April 2025, tens of thousands of farmers have been manually recording growth stage observations in FieldView, without an ability to make use of these observations. The lack of streamlined tools drives up both operational costs and time investment.
Productivity: Today, growers and advisors engage in scouting, in-field observations to monitor the growth and health of crops. When pests are imminent, fields need to be scouted even more frequently. As of April 2025, tens of thousands of farmers have been manually recording growth stage observations in FieldView, without an ability to make use of these observations. The lack of streamlined tools drives up both operational costs and time investment.
2
Accuracy: FieldView currently shows Growing Degree Units (GDUs), merely an approximation for growth stages. Growth stage calculations change based on hybrid, planting date, as well as other environmental factors. Without precise insights into current and forecasted growth stages, growers and advisors struggle to align scouting and treatment strategies with a crop’s biological needs—resulting in missed opportunities or ineffective interventions.
Accuracy: FieldView currently shows Growing Degree Units (GDUs), merely an approximation for growth stages. Growth stage calculations change based on hybrid, planting date, as well as other environmental factors. Without precise insights into current and forecasted growth stages, growers and advisors struggle to align scouting and treatment strategies with a crop’s biological needs—resulting in missed opportunities or ineffective interventions.
3
Personalization: Many crop protection products are only approved for use within narrow phenological windows. At the same time, environmental variables, such as weather and soil conditions, influence the efficacy of these applications. Farmers and advisors lack a holistic view that combines phenology and environmental data, which would give them more confidence in preventing crop damage.
Personalization: Many crop protection products are only approved for use within narrow phenological windows. At the same time, environmental variables, such as weather and soil conditions, influence the efficacy of these applications. Farmers and advisors lack a holistic view that combines phenology and environmental data, which would give them more confidence in preventing crop damage.
Solution
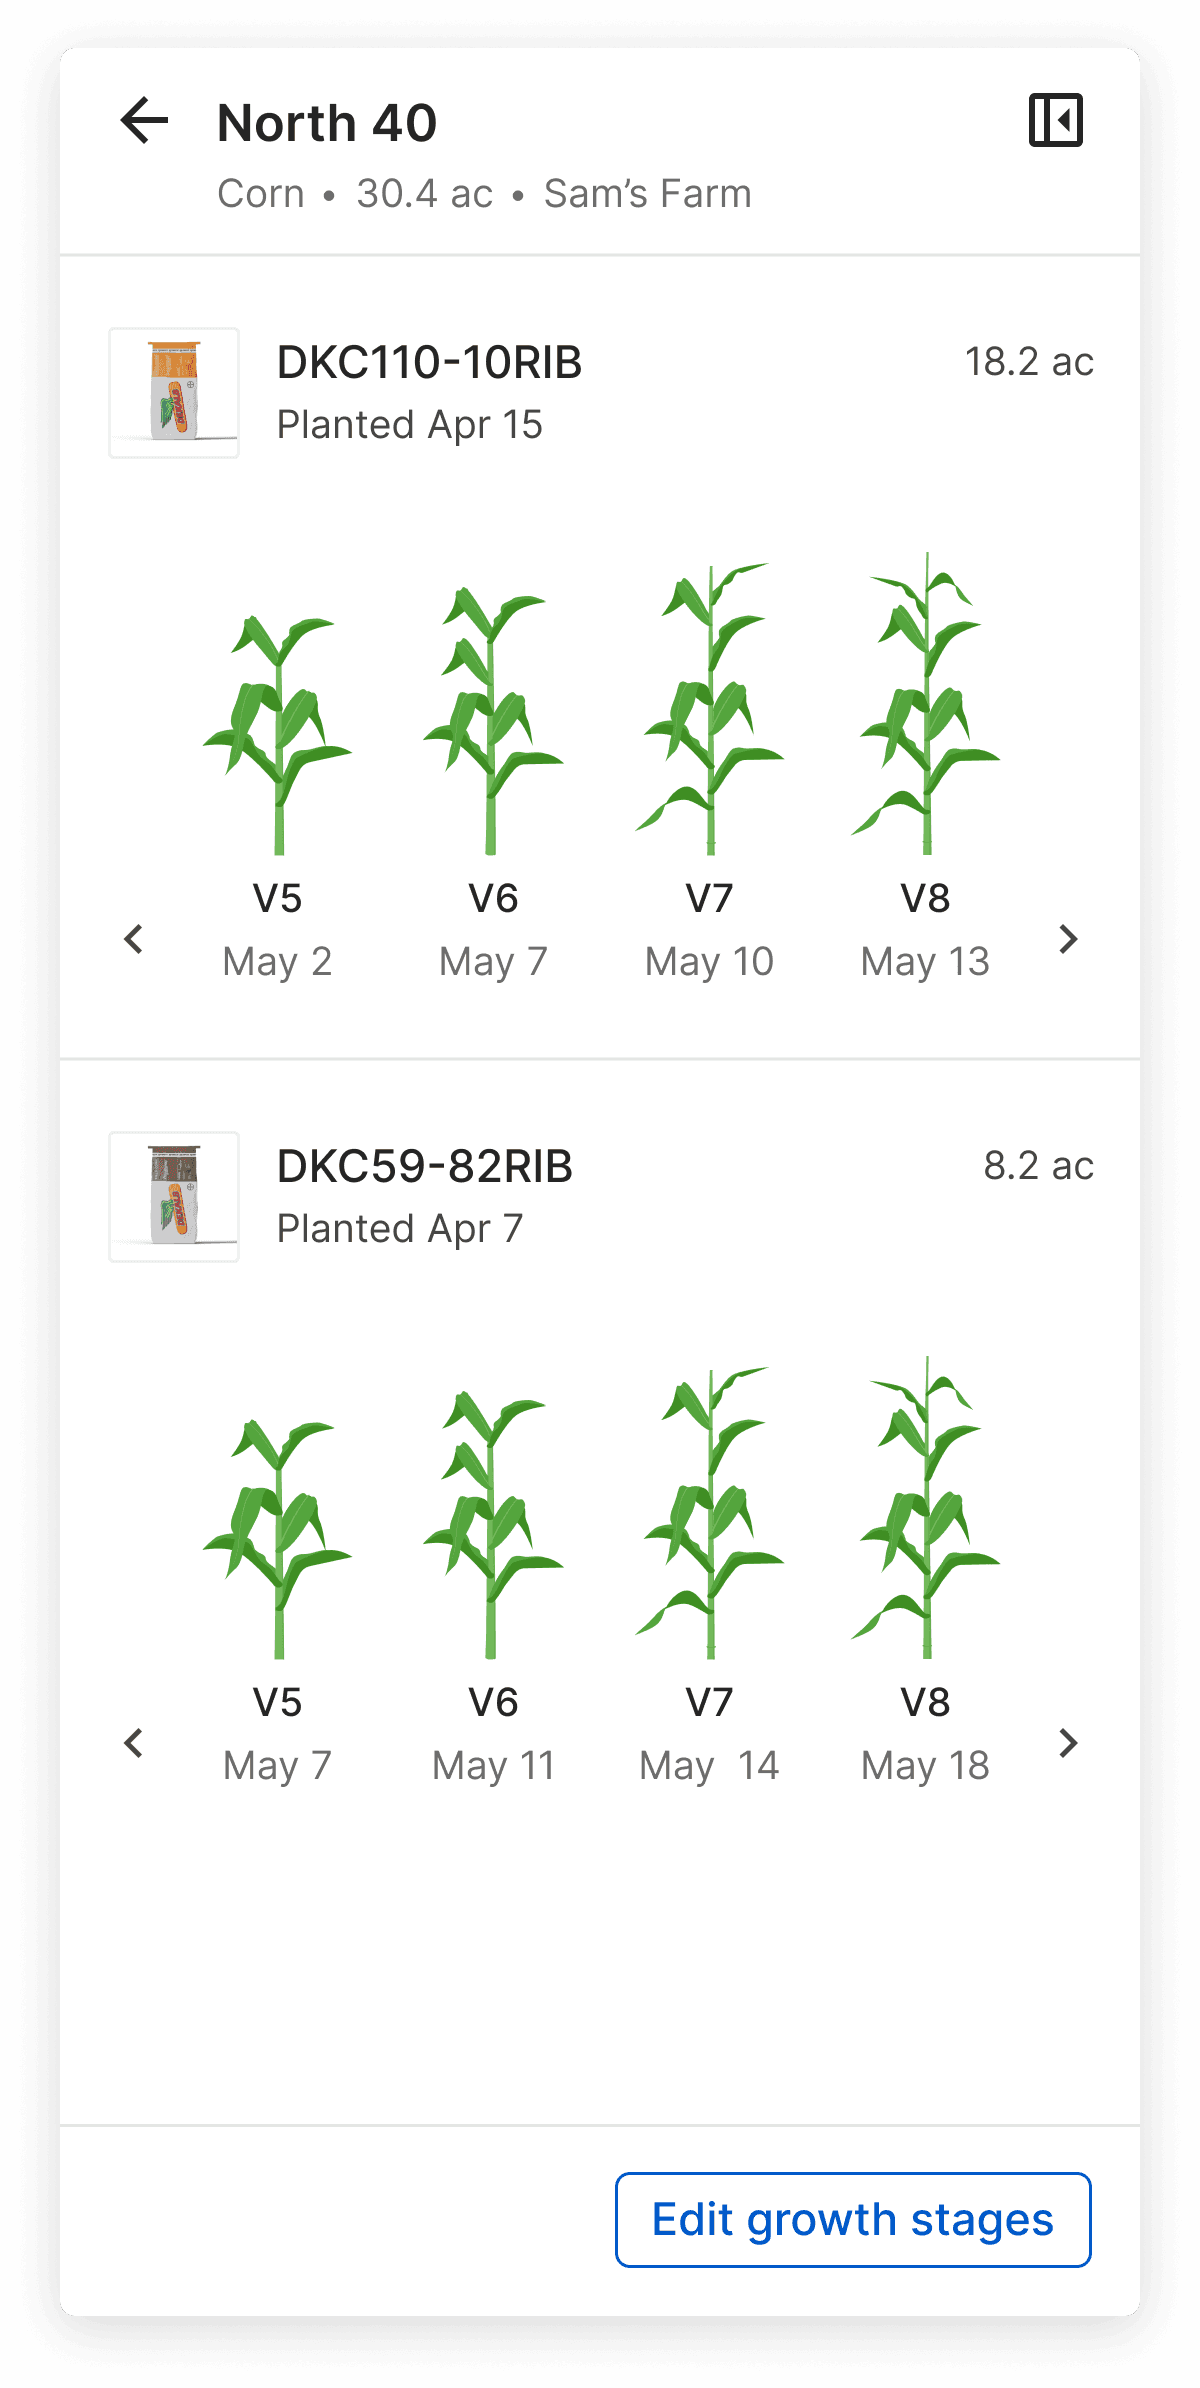
I led the design for a FieldView pilot experience, using predictive insights to help customers monitor growth stages and environmental threats across their operations.
The pilot brings growth stage and disease risk predictions to life through a digestible, customizable, and intuitive user experience. It enables customers to track crop progress, pinpoint problem areas in the field, and plan smarter scouting routes. The experience connects web and mobile tools, bridging what happens in the office and in the field. As part of this work, I partnered with cross-functional teams to lay the groundwork for visualizing map data across the platform.
The pilot brings growth stage and disease risk predictions to life through a digestible, customizable, and intuitive user experience. It enables customers to track crop progress, pinpoint problem areas in the field, and plan smarter scouting routes. The experience connects web and mobile tools, bridging what happens in the office and in the field. As part of this work, I partnered with cross-functional teams to lay the groundwork for visualizing map data across the platform.

Impact
"
I've been asking for a tool like this since 2015."
Pre-Launch
•
85% task success rate
•
Validated with 15+ advisors and growers
•
Preliminary pilot of the growth stage prediction model (sans interface) to gauge accuracy and potential edge cases
•
Robust set of design system components
Post-Launch Goals
•
Weekly engagement by at least 50% of pilot users
•
75% of users report improved timing decisions
•
30% reduction in manual scouting time
•
95%+ growth stage prediction accuracy
Map & Table Views
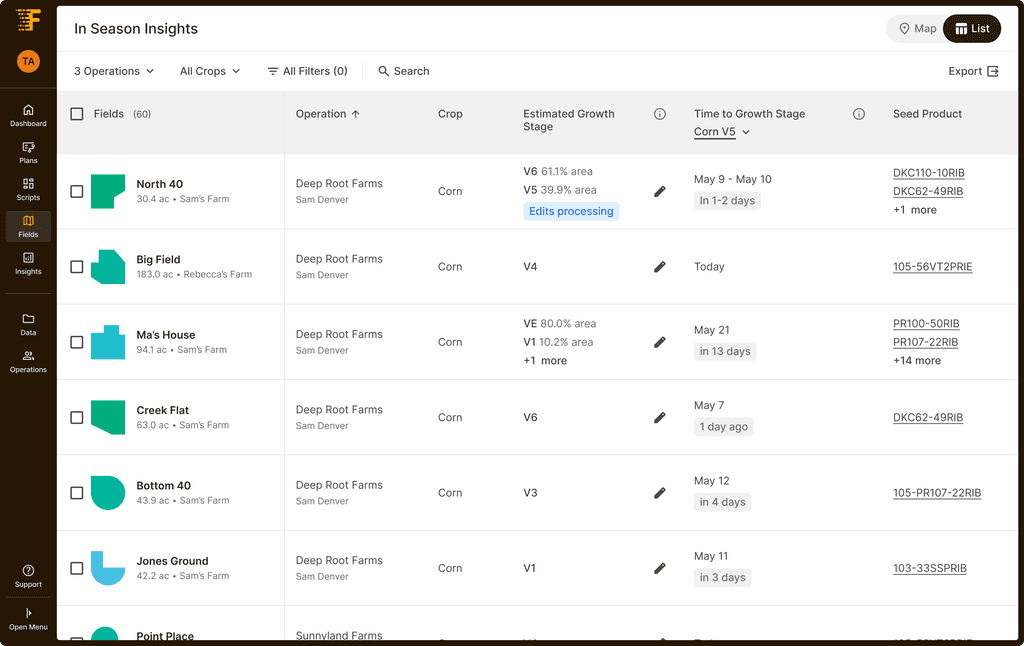
Customers monitor their fields through two complementary views: a table for quick comparisons and a map for spatial detail. The table gives customers a quick snapshot of growth stages, and how they correlate with environmental factors influencing crop development. The map lets customers drill into specific areas, and plan smarter scouting routes to maximize time and resources.
Customers monitor their fields through two complementary views: a table for quick comparisons and a map for spatial detail. The table gives customers a quick snapshot of growth stages, and how they correlate with environmental factors influencing crop development. The map lets customers drill into specific areas, and plan smarter scouting routes to maximize time and resources.
Zooming Behavior
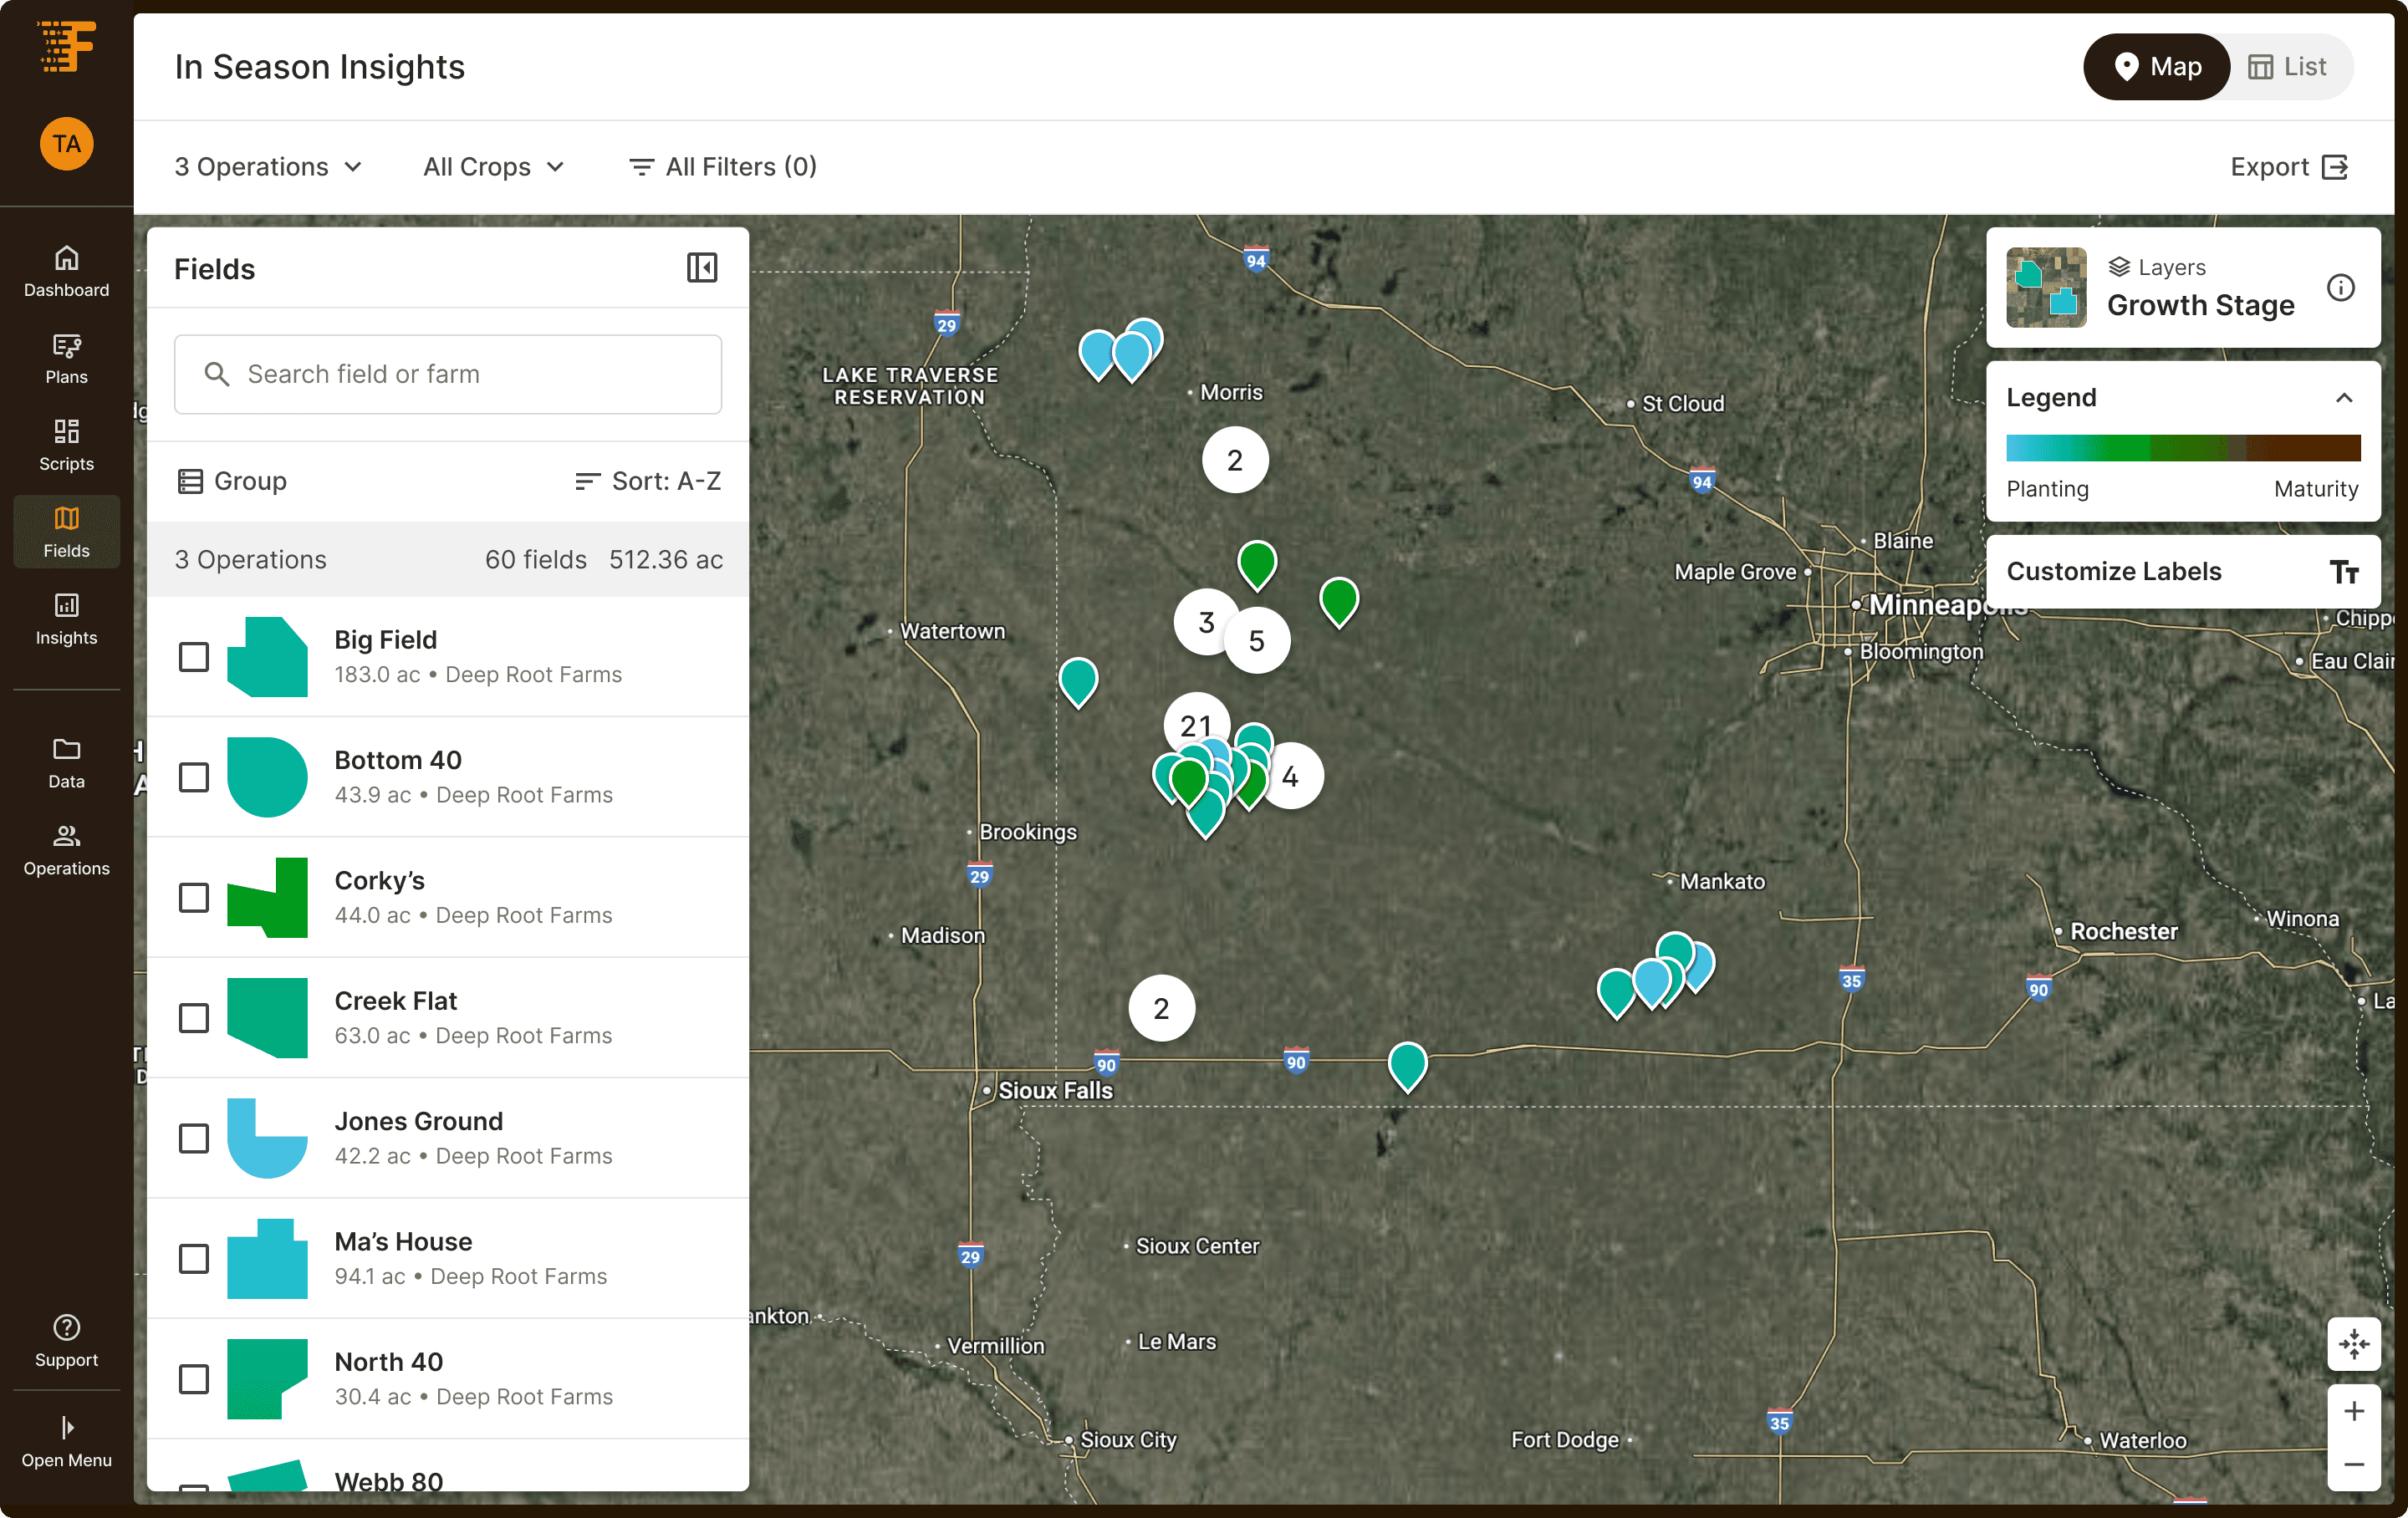
Switching between operational and field level views used to feel clunky. We designed a new zooming behavior that flows naturally between different altitudes of information, allowing customers to move between a multi-field view and in-field view without losing context. Our design would set the foundation for all map-based patterns across FieldView.
Zoom Level 1
Zoom Level 1
Zoom Level 3
Zoom Level 3

Zoom Level 2
Zoom Level 2

Zoom Level 4
Zoom Level 4

Scalable Components & Tokens
As part of the pilot, we took a holistic look at map-based experiences in FieldView and built a set of scalable patterns designed to work across the platform. These patterns were the first to make use of global tokens and stress-test them for usability.
As part of the pilot, we took a holistic look at map-based experiences in FieldView and built a set of scalable patterns designed to work across the platform. These patterns were the first to make use of global tokens and stress-test them for usability.
Legend
keyboard_arrow_up
Planting
Maturity
CORN
{
"colors": [
{
"color": "lightblue",
"stop": 0.01
},
{
"color": "green",
"stop": 0.33
},
{
"color": "yellow",
"stop": 0.67
},
{
"color": "red",
"stop": 1
}
],
"domain": [
"P",
"VE",
"V1",
"V2",
"V3",
"V4",
"V5",
"V6",
"V7",
"V8",
"V9",
"V10",
"V11",
"V12",
"V13",
"V14",
"V15",
"V16",
"V17",
"V18",
"R1",
"R2",
"R3",
"R4",
"R5",
"R6"
],
"vibrancy": 0.7,
"targetLc": 40,
"againstColor": "white",
"outputFormat": "hex",
"interpolation": "oklch",
"gamut": "p3",
"direction": -1,
"colorBlindSafe": true,
"debug": false
}
SOYBEAN
{
"colors": [
{
"color": "lightblue",
"stop": 0.01
},
{
"color": "green",
"stop": 0.33
},
{
"color": "yellow",
"stop": 0.67
},
{
"color": "red",
"stop": 1
}
],
"domain": [
"P",
"VE",
"VC",
"V1",
"V2",
"V3",
"V4",
"V5",
"V6",
"V7",
"V8",
"V9",
"R1",
"R2",
"R3",
"R4",
"R5",
"R6",
"R7",
"R8"
],
"vibrancy": 0.7,
"targetLc": 40,
"againstColor": "white",
"outputFormat": "hex",
"interpolation": "oklch",
"gamut": "p3",
"direction": -1,
"colorBlindSafe": true,
"debug": false
}

Custom Labels
Growth stage predictions are most useful when paired with other field attributes. Customers may want to view planting dates to help plan out scouting routes, or seed products to determine what applications to make. Custom labels let users adapt the map to their specific needs, giving flexibility for different workflows.
Growth stage predictions are most useful when paired with other field attributes. Customers may want to view planting dates to help plan out scouting routes, or seed products to determine what applications to make. Custom labels let users adapt the map to their specific needs, giving flexibility for different workflows.

Bridging In Office and Field Work
I connected the ways in which customers work with growth stages on and off the field. At home, they use the desktop experience to evaluate fields in depth and prioritize which ones to visit. Mobile, on the other hand, is most useful for scouting—inspecting crops for threats and growth progression in real time. Observed growth stages feed back into the prediction model to improve accuracy, while predictions help cross-check what they see in the field.
I connected the ways in which customers work with growth stages on and off the field. At home, they use the desktop experience to evaluate fields in depth and prioritize which ones to visit. Mobile, on the other hand, is most useful for scouting—inspecting crops for threats and growth progression in real time. Observed growth stages feed back into the prediction model to improve accuracy, while predictions help cross-check what they see in the field.


Impact
"
I've been asking for a tool like this since 2015."
Pre-Launch
•
85% task success rate
•
Validated with 15+ advisors and growers
•
Preliminary pilot of the growth stage prediction model (sans interface) to gauge accuracy and potential edge cases
•
Robust set of design system components
Post-Launch Goals
•
Weekly engagement by at least 50% of pilot users
•
75% of users report improved timing decisions
•
30% reduction in manual scouting time
•
95%+ growth stage prediction accuracy
Impact
"
I've been asking for a tool like this since 2015."
Pre-Launch
•
85% task success rate
•
Validated with 15+ advisors and growers
•
Preliminary pilot of the growth stage prediction model (sans interface) to gauge accuracy and potential edge cases
•
Robust set of design system components
Post-Launch Goals
•
Weekly engagement by at least 50% of pilot users
•
75% of users report improved timing decisions
•
30% reduction in manual scouting time
•
95%+ growth stage prediction accuracy
Learnings
Bringing people and teams together to build patterns that can be leveraged across the product. Siloed working styles led to major gaps in the design system and compounding levels of design debt. Alongside the organization’s effort to overhaul the design system, I led a cross-functional working group to build consistent map-based design patterns in FieldView.
Bringing people and teams together to build patterns that can be leveraged across the product. Siloed working styles led to major gaps in the design system and compounding levels of design debt. Alongside the organization’s effort to overhaul the design system, I led a cross-functional working group to build consistent map-based design patterns in FieldView.
Uncovering adjacent areas of opportunity and understanding where they may fit in the product vision. While working on key epics, I discovered new problem areas to put on product’s radar and to build an understanding around its impact towards existing and future work.
Uncovering adjacent areas of opportunity and understanding where they may fit in the product vision. While working on key epics, I discovered new problem areas to put on product’s radar and to build an understanding around its impact towards existing and future work.
Rolling out a new design system while building new, integrated features. As our team was building new features for the pilot, the entire design system was being phased out and replaced with a new, tokenized one. I worked closely with cross-functional teams to stress test the new design system and make the transition as seamless as possible.
Rolling out a new design system while building new, integrated features. As our team was building new features for the pilot, the entire design system was being phased out and replaced with a new, tokenized one. I worked closely with cross-functional teams to stress test the new design system and make the transition as seamless as possible.
Science and design form a two-way street. We let science-based prediction models inform us of edge cases we may not have anticipated. At the same time, we did not want a rigid model hurting our user experience. We used our understanding of customers to shape the prediction model to be as meaningful as possible.
Science and design form a two-way street. We let science-based prediction models inform us of edge cases we may not have anticipated. At the same time, we did not want a rigid model hurting our user experience. We used our understanding of customers to shape the prediction model to be as meaningful as possible.